Mapping Watershed Health for the Pine Hollow River
Summary
The Pine Hollow watershed faced growing concerns over sedimentation, nutrient runoff, and habitat degradation. GIS technology was used to analyze water quality trends, identify high-risk areas, and support community-based conservation efforts.
Full Write-Up
Background
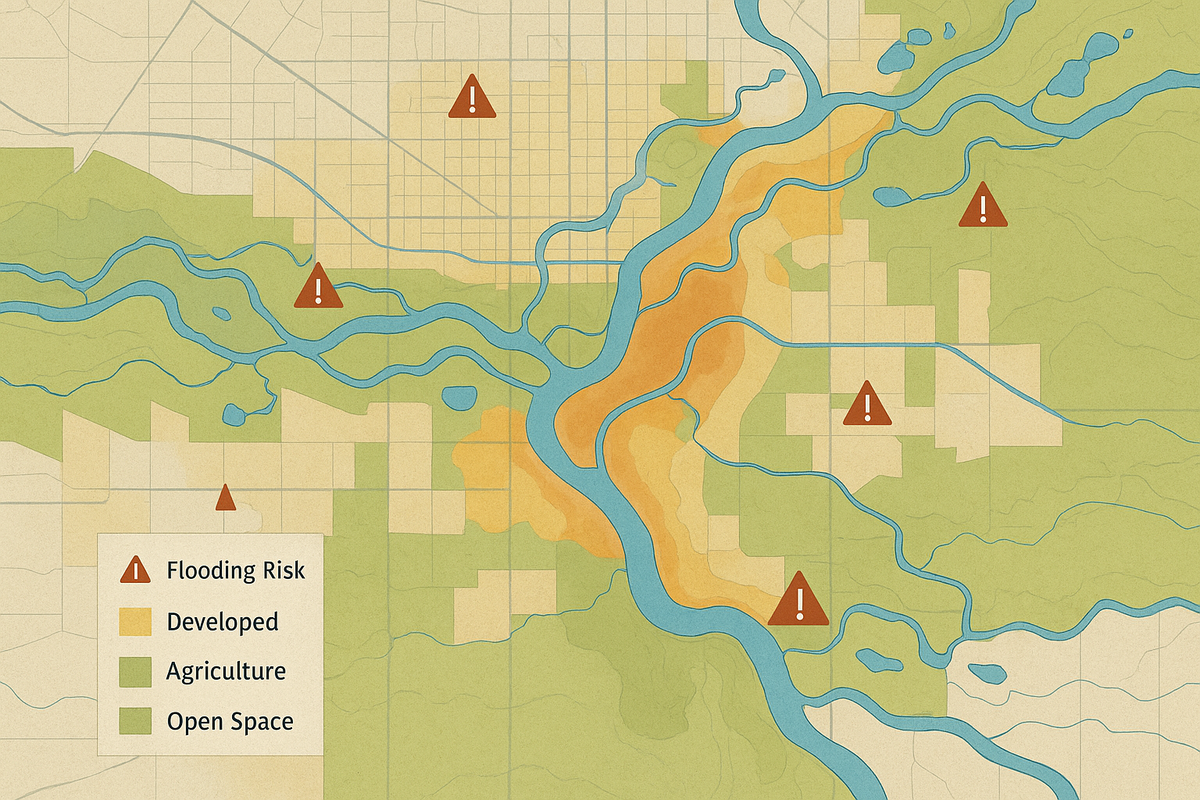
Pine Hollow River runs through farmland, residential communities, and protected wetlands. Over the past decade, water quality reports showed rising nitrate levels and sediment buildup, threatening aquatic life and drinking water supplies.
Objectives
- Analyze land use and runoff patterns contributing to nutrient loading.
- Identify critical erosion zones along the riverbanks.
- Create a watershed health index for decision-makers and conservation groups.
- Develop a long-term monitoring dashboard.
Methodology
- Data Sources:
- Satellite imagery and LiDAR elevation data for terrain analysis.
- Historical water quality sampling points.
- Land cover classifications for agricultural vs. natural areas.
- GIS Techniques:
- Watershed delineation using hydrology tools.
- Buffer zones around agricultural fields to assess runoff risk.
- Weighted overlay model to generate a Watershed Health Index.
- Visualization:
Heatmaps highlighted pollution hotspots, while time-series animations tracked improvements after conservation measures.
Results
- Identified five high-priority erosion sites requiring immediate stabilization.
- Highlighted areas where targeted buffer vegetation could reduce nutrient runoff by 25%.
- Provided stakeholders with a web-based dashboard for ongoing monitoring.
Impact
Local governments and environmental groups now have a data-driven action plan to restore the Pine Hollow River and protect aquatic biodiversity for future generations.